Orogenic Exploration Pty Ltd
Welcome
Consulting
• Australian Potash Brine
• Capturing Data
• Ellendale Lamproite
• Parnaroo Loam Grid
• World Map Index
Projects ↴
• Flinders Island
Previous Projects ↴
• Eyre Peninsula
• Shell Lagoon
• Terowie South
Project Generation
Image Galleries ↴
• Diamond Exploration
• Metal Exploration
Contact
Capturing Historical Data
It is important to maximise the understanding of an areas mineral potential and the quickest and cheapest source of information is by using previous historical exploration data. However, without experience and understanding it is easy to misuse or inappropriately interpret the data. There are many reasons why historical exploration programs may have missed their targets. It may be as simple as not sampling every creek because of budget constraints, or not understanding that microprobing the outer surface of a mineral grain will not give a true representative chemical analyses, potentially resulting in a wrong assessment.
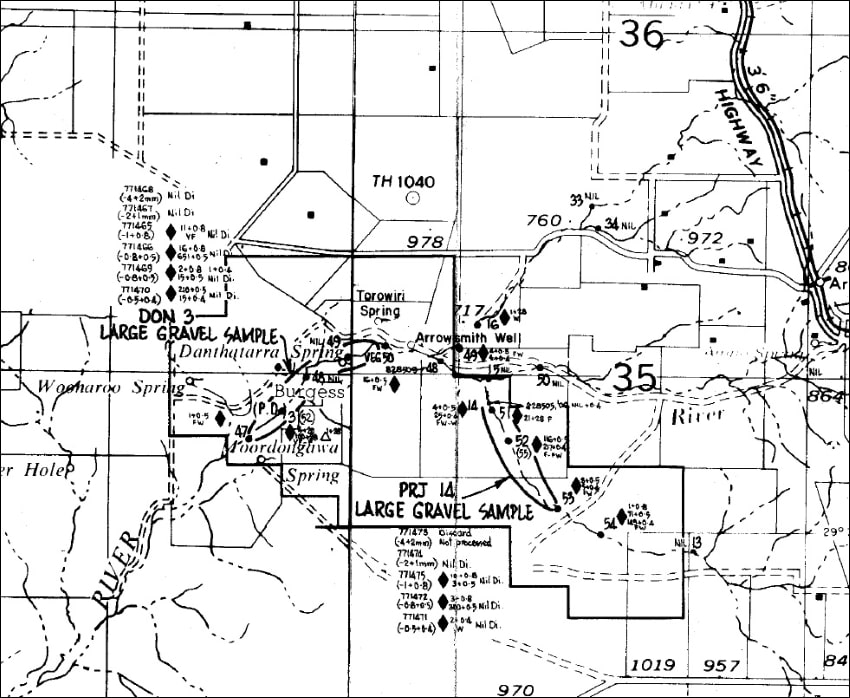
Even capturing historical data requires an understanding of exploration practice over time. The map below is a very typical presentation of diamond exploration sampling results by a major company in Australia in 1982. The hand drawn map obtained from an open file historical company report shows the location of samples and the indicator grain results.

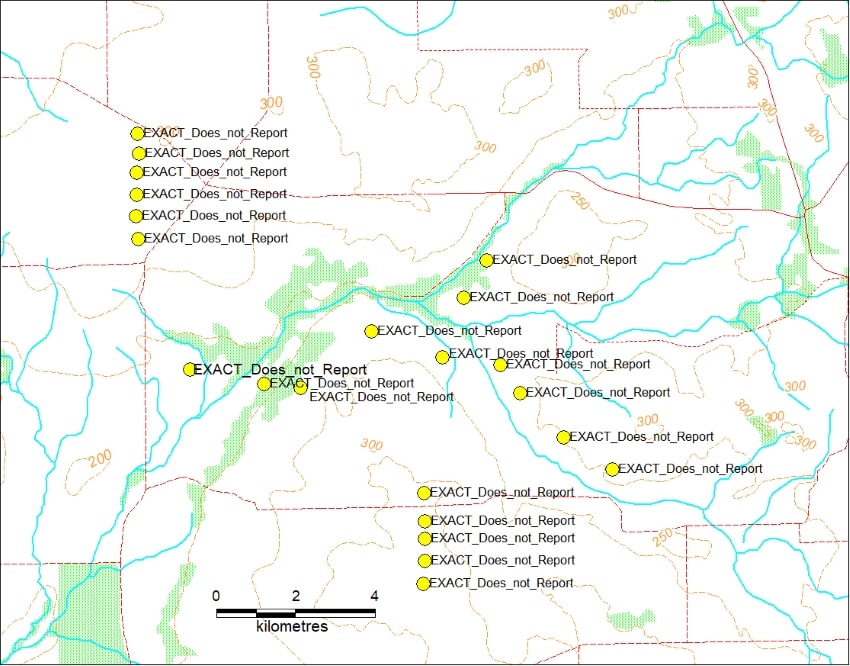
Some Mines Departments in Australia have captured open-file diamond exploration data in an attempt to encourage and promote further exploration. The departments provided tables with extensive details on company samples. The map below shows the samples captured by the government over the same area as the company map above. It is clear that the Department has not understood the company map with the symbols used visually to display the results (black diamond symbol used to represent chromites recovered from each size fraction) captured as actual sample location points. The sample identification was recorded by the Department simply as "EXACT_Does_not_Report", which make it impossible to relate any one sample to discussions within the text of the report.

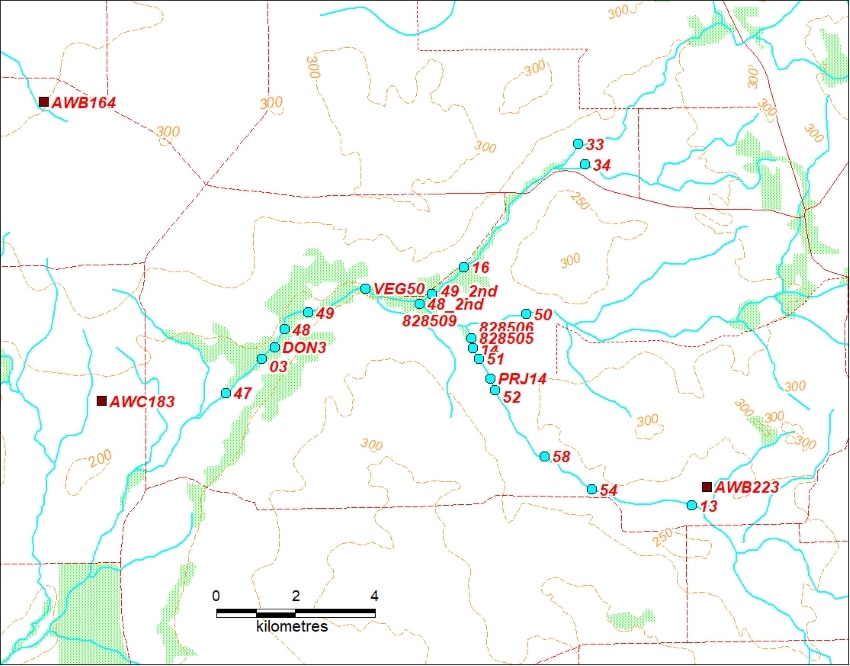
Below is the same map area with samples captured by Orogenic Exploration from the same historical report. The blue circles represent locations of heavy mineral stream sediment samples. The brown squares are heavy mineral loam deflation scapes over target sites but were captured from a different map in the same company report. These loam samples were not captured by the Mines Department. Both type of samples have labels in red showing the sample numbers used by the original exploration company.

It is clear that the map based on data captured by Orogenic Exploration is a better representation of the 1982 company sampling. The Department database sample locations for this area gives the impression the samples were not from the creeks and thus further time would have been wasted on checking of historical records to explain why the company sampled where they did.
This is a simple example of someone capturing historical exploration data without understanding the map they are examining. The Mines Department and the general location involved has not been identified to restrict further embarrassment.
Authorised by Steven Cooper
Maintained by Ian Savicky
Copyright Notice and Disclaimer